Posts

Showing posts from 2018

The big picture !

Image
I was on a vacation and could not post the ST trend changes. While i was on vacation, the intermediate term trend turned up. LT - BULLISH IT - BULLISH  Intermediate term is bullish, but the price action is corrective, range-bound and messy. Below 2680, it would turn bearish. ST - Bearish Short term is bearish at this point, trying to bottom.

Trend update - ST trend change

These are the trends in various timeframes based on a objective trend identification methodology. No "If"s and "But"s are allowed. LONG TERM This controls the long term trends which runs for years, mostly good for investors. To me this is the timeframe which determines bull and bear markets. Currently  BULLISH Will turn bearish approximately around 2500 level. Will publish the exact level, if and when we break 2500. INTERMEDIATE TERM This controls the medium term trends which run for weeks to a few months. Trading in the direction of the intermediate term trend offers the highest risk/reward and path of least resistance for short and medium term traders. Currently BEARISH Will turn bullish approximately around 2760 level. Will publish the exact level, if and when we break 2760. SHORT TERM This controls the short term trends which runs anywhere from 2 - 15 days. These signals can change quickly and for nimble short term traders

Trend Update - ST trend change

These are the trends in various timeframes based on a objective trend identification methodology. No "If"s and "But"s are allowed. LONG TERM This controls the long term trends which runs for years, mostly good for investors. To me this is the timeframe which determines bull and bear markets. Currently  BULLISH Will turn bearish approximately around 2500 level. Will publish the exact level, if and when we break 2500. INTERMEDIATE TERM This controls the medium term trends which run for weeks to a few months. Trading in the direction of the intermediate term trend offers the highest risk/reward and path of least resistance for short and medium term traders. Currently BEARISH Will turn bullish approximately around 2760 level. Will publish the exact level, if and when we break 2760. SHORT TERM This controls the short term trends which runs anywhere from 2 - 15 days. These signals can change quickly and for nimble short term traders

Trend update - Short term trend change

These are the trends in various timeframes based on a objective trend identification methodology. No "If"s and "But"s are allowed. LONG TERM This controls the long term trends which runs for years, mostly good for investors. To me this is the timeframe which determines bull and bear markets. Currently  BULLISH Will turn bearish approximately around 2500 level. Will publish the exact level, if and when we break 2500. INTERMEDIATE TERM This controls the medium term trends which run for weeks to a few months. Trading in the direction of the intermediate term trend offers the highest risk/reward and path of least resistance for short and medium term traders. Currently BEARISH Will turn bullish approximately around 2760 level. Will publish the exact level, if and when we break 2760. SHORT TERM This controls the short term trends which runs anywhere from 2 - 15 days. These signals can change quickly and for nimble short term traders

This is not a game for those who are used to getting straight "A"s

At the outset, i would like to make it clear that i have nothing but respect for those with straight "A"s and i am in no way belittling their contribution to mankind. While their contribution in science, technology, literature etc has been tremendous, their IQ is of very little value when it comes to trading. In fact, it's a handicap. As a disclosure, I am one of those guys with straight "A"s but went through a long process of transfromation before i became a sucessful trader. I don't think there is any profession which is as counter-intuitive as trading. This is not a game for the perfectionists. This is not a game for those who are used to getting straight "A"s in their college. It becomes all the more difficult for those with impeccable academic credentials. Trading is all about imperfection. You get a lot of "F"s a.k.a stop-outs and occasional "A"s a.k.a winners, not exactly the kind of treatment the best and the brighte

Trend Update - Short term trend change

These are the trends in various timeframes based on a objective trend identification methodology. No "If"s and "But"s are allowed. LONG TERM This controls the long term trends which runs for years, mostly good for investors. To me this is the timeframe which determines bull and bear markets. Currently  BULLISH Will turn bearish approximately around 2500 level. Will publish the exact level, if and when we break 2500. INTERMEDIATE TERM This controls the medium term trends which run for weeks to a few months. Trading in the direction of the intermediate term trend offers the highest risk/reward and path of least resistance for short and medium term traders. Currently BEARISH Will turn bullish approximately around 2760 level. Will publish the exact level, if and when we break 2760. SHORT TERM This controls the short term trends which runs anywhere from 2 - 15 days. These signals can change quickly and for nimble short term traders

Trend update - Short term trend change

These are the trends in various timeframes based on a objective trend identification methodology. No "If"s and "But"s are allowed. LONG TERM This controls the long term trends which runs for years, mostly good for investors. To me this is the timeframe which determines bull and bear markets. Currently  BULLISH Will turn bearish approximately around 2500 level. Will publish the exact level, if and when we break 2500. INTERMEDIATE TERM This controls the medium term trends which run for weeks to a few months. Trading in the direction of the intermediate term trend offers the highest risk/reward and path of least resistance for short and medium term traders. Currently BEARISH Will turn bullish approximately around 2760 level. Will publish the exact level, if and when we break 2760. SHORT TERM This controls the short term trends which runs anywhere from 2 - 15 days. These signals can change quickly and for nimble short term traders

What exactly is Trading Edge ?

Any trader in the markets, for any length of time understand that in order to suceed as a trader they need to have: 1) Trading system with an edge 2) Money management 3) Good trader psychology and emotional quotient Trading edge is a necessary condition, but not a sufficient condition. Even a system with a positive expentancy can end up in ruin with bad money management (position sizing). It's called the "Gambler's ruin". I will talk more about that in a different post. Even with a good trading edge and money management, you could fail if you do not have the right psychology to execute the trade and persist in the face of losses. That's another subject for another post. 1), 2) and 3) are necessary conditions, but not sufficient conditions in themselves. I have heard people say flippantly that even a coin toss with good money managment can make money in the long run. Absolutely untrue ! If you do not have a trading edge, money management and psycholog

Trend Update - Short term trend change

These are the trends in various timeframes based on a objective trend identification methodology. No "If"s and "But"s are allowed. LONG TERM This controls the long term trends which runs for years, mostly good for investors. To me this is the timeframe which determines bull and bear markets. Currently  BULLISH Will turn bearish approximately around 2500 level. Will publish the exact level, if and when we break 2500. INTERMEDIATE TERM This controls the medium term trends which run for weeks to a few months. Trading in the direction of the intermediate term trend offers the highest risk/reward and path of least resistance for short and medium term traders. Currently BEARISH Will turn bullish approximately around 2760 level. Will publish the exact level, if and when we break 2760. SHORT TERM This controls the short term trends which runs anywhere from 2 - 15 days. These signals can change quickly and for nimble short term traders

The "Trump impeachment channel"

Image
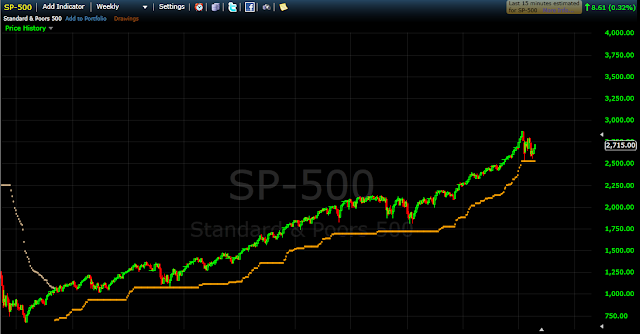
Well, since folks love to use the term "Trump rally", i thought i would use the term "Trump impeachment channel" for the long term controlling channel. Currently the channel lies around SPX 2500. If SPX 2500 breaks, it would be a full fledged bear market. You can forget about any subsequent new highs, if that happens. As long as S&P trades above 2500, the bull market is alive and well. Well, firstly i don't like the term "Trump rally", as it would assign the stock market rally causality to politicians. If the 40% rally in 2017 was the Trump rally, then the 200% rally off the SPX 666 lows should be called the "Obama rally". We know both are not true. The Trump impeachment talks have been going on for over an year. As long as the stock market trades above that long term channel, i would say "Forget it !". No impeachment will occur until the social mood turns sour and the market enters a bear phase. Right now everybody is

Trend update - Short term trend change

These are the trends in various timeframes based on a objective trend identification methodology. No "If"s and "But"s are allowed. LONG TERM This controls the long term trends which runs for years, mostly good for investors. To me this is the timeframe which determines bull and bear markets. Currently  BULLISH Will turn bearish approximately around 2500 level. Will publish the exact level, if and when we break 2500. INTERMEDIATE TERM This controls the medium term trends which run for weeks to a few months. Trading in the direction of the intermediate term trend offers the highest risk/reward and path of least resistance for short and medium term traders. Currently BEARISH Will turn bullish approximately around 2760 level. Will publish the exact level, if and when we break 2760. SHORT TERM This controls the short term trends which runs anywhere from 2 - 15 days. These signals can change quickly and for nimble short term traders

Trend Update - Short term trend change

These are the trends in various timeframes based on a objective trend identification methodology. No "If"s and "But"s are allowed. LONG TERM This controls the long term trends which runs for years, mostly good for investors. To me this is the timeframe which determines bull and bear markets. Currently  BULLISH Will turn bearish approximately around 2500 level. Will publish the exact level, if and when we break 2500. INTERMEDIATE TERM This controls the medium term trends which run for weeks to a few months. Trading in the direction of the intermediate term trend offers the highest risk/reward and path of least resistance for short and medium term traders. Currently BEARISH Will turn bullish approximately around 2760 level. Will publish the exact level, if and when we break 2760. SHORT TERM This controls the short term trends which runs anywhere from 2 - 15 days. These signals can change quickly and for nimble short term traders

What the bulls are up against !

Image
This is what is making the breakout so difficult. If bulls breakout and sustain above SPX 2675, it would mean a horizontal breakout, wedge breakout, three fan line breakout and an inverse H&S breakout. Make no mistake. This is the most bullish pattern you can find, if we breakout. If we fail to breakout, it will be uber-bearish. If you are carrying positions overnight,  wait for either a confirmed breakout, even if it means buying higher or make sure you sit on enough profit buffer. A pattern failure here and a gap down on some tweet from POTUS could be huge. My short term trend signal from April 9 remains on a buy, but has not made any upside progress since then.

Trend update - Short term trend change

These are the trends in various timeframes based on a objective trend identification methodology. No "If"s and "But"s are allowed. LONG TERM This controls the long term trends which runs for years, mostly good for investors. To me this is the timeframe which determines bull and bear markets. Currently  BULLISH Will turn bearish approximately around 2500 level. Will publish the exact level, if and when we break 2500. INTERMEDIATE TERM This controls the medium term trends which run for weeks to a few months. Trading in the direction of the intermediate term trend offers the highest risk/reward and path of least resistance for short and medium term traders. Currently BEARISH Will turn bullish approximately around 2760 level. Will publish the exact level, if and when we break 2760. SHORT TERM This controls the short term trends which runs anywhere from 2 - 15 days. These signals can change quickly and for nimble short term traders

My 5 cents on tariffs

There’s been a raging debate on whether tariffs and protectionism is good or bad for the U.S economy and the stocks. I do not want to make this a political debate, as i have a distrust for politicians in general., whether left or right, democrats or republicans.   I keep hearing this argument that our politicians sold America, by allowing China to practise it’s protectionist policies and let the trade-deficit balloon.   Really ? But the elephant in the room that nobody wants to talk about is how capitalism and free markets work. Profits is GOD when it comes to capitalism and social costs take a backseat. So when there is a wage arbitrage to be exploited, the corporations are going to exploit it. Trump’s own family has manufacturing interests in China. That’s how capitalism works and you have to live with the consequences, if capitalism and free markets are your religion. It’s not the politicians, but the businessman who moved the jobs overseas in pursuit of profits, which

Trend update - Short term trend change

These are the trends in various timeframes based on a objective trend identification methodology. No "If"s and "But"s are allowed. LONG TERM This controls the long term trends which runs for years, mostly good for investors. To me this is the timeframe which determines bull and bear markets. Currently BULLISH Will turn bearish approximately around 2500 level. Will publish the exact level, if and when we break 2500. INTERMEDIATE TERM This controls the medium term trends which run for weeks to a few months. Trading in the direction of the intermediate term trend offers the highest risk/reward and path of least resistance for short and medium term traders. Currently BEARISH Will turn bullish approximately around 2760 level. Will publish the exact level, if and when we break 2760. SHORT TERM This controls the short term trends which runs anywhere from 2 - 15 days. These signals can change quickly and for nimble short term traders.

Long term, Intermediate term and Short Term trends

These are the trends in various timeframes based on a objective trend identification methodology. No "If"s and "But"s are allowed. LONG TERM This controls the long term trends which runs for years, mostly good for investors. To me this is the timeframe which determines bull and bear markets. Currently BULLISH Will turn bearish approximately around 2500 level. Will publish the exact level, if and when we break 2500. INTERMEDIATE TERM This controls the medium term trends which run for weeks to a few months. Trading in the direction of the intermediate term trend offers the highest risk/reward and path of least resistance for short and medium term traders. Currently BEARISH Will turn bullish approximately around 2760 level. Will publish the exact level, if and when we break 2760. SHORT TERM This controls the short term trends which runs anywhere from 2 - 15 days. These signals can change quickly and for nimble short term traders.

S&P short term trend - UP

My system which has been in a short-term downtrend since the Fed meeting day, has turned bullish at SPX 2662.5 today. It's in a buy-the-dips mode for now. The market seems to be digesting the overhead supply pretty well so far. 

Trend update

The short-term trend has been down since the Fed meeting day and has been on a continuation sell since March 27. If you view every bounce as a start of new trend, then you would have been chopped to pieces, every other day. Trend turns take time, not just price. In the context of a downtrend, bigger the bounce, the juicier the short. In a downtrend you need to short at the point of lowest volatility (which is near peak of the bounces) and get out using a trailing stop when the volatility gets high. Trying to short when the volatility is high or trying to buy when the volatility is low is disastrous. Many of them have learn't this costly lesson in the last few months. Right now we have another bounce and the volatility should drop significantly by tomorrow. The size of the bounce has pushed this close to a buy, but not quite yet. We are now again at an inflection point, which should get resolved in a day or two.

Sentiment - Long term vs short term

While the CNN fear and greed index can be a good indicator of short-term tops and bottoms, there is something more sinister at play here. Whenever the CNN fear and greed index goes to the extremes, a reflex bounce occurs to reset the sentiment. But that may not create the necessary conditions for a sustainable intermediate-term bottom. Here's why. The investors intelligence survey recorded some extremes in spreads between the bears and bulls. The spread even exceeded the 1987 top. I posted this many times on traders-talk.com. But this was largely ignored by amateurs and professionals alike, as the parabolic move gave a false sense of security that nothing could go wrong. The amount of froth and participation required to create a parabolic advance, in itself is a huge measure of sentiment. You don't need any sentiment surveys. Just one look at Dec 2017 to Feb 2018 charts of Bitcoin, ICOs and the S&P/DOW/Nasdaq should sum it all up. What differentiates a minor top from a